Mechanisms of Species Diversity Change in Stressed Environments
Ehud Meron
The impacts of environmental changes on species diversity, and thus on ecosystem function and stability, is a central topic of current ecological research. While such changes may independently affect animal and plant species, plants standout in being primary producers; by storing solar energy in chemical compounds they constitute the basal trophic level of the food chain that animal species, including humans, depend on. Plant communities respond to environmental changes at different scales. At the landscape scale, where symmetry breaking vegetation patterns appear (Fig. 1), a transition from one pattern state to another may take place (Animation 1). At smaller, single-patch scales, environmental changes may affect inter- and intra-specific plant interactions. Using a mathematical modeling approach, we developed a theory of plant communities in water limited system, and are currently using it to highlight mechanisms of species diversity change in response to climate changes and disturbances. Special attention is given to mechanisms that involve different levels of organization, e.g. mechanisms by which pattern transitions at the landscape level affect plant interactions and species richness at the single-patch level.
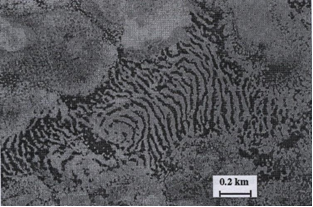
Figure 1: Aerial photograph of vegetation bands on hill slopes in Niger. Reprinted from C. Valentin, J. M. d'Herbes, and J. Poesen, Catena 37, 1 (1999), ©1999.
Animation 1: Model simulation showing a transition from a banded vegetation pattern to a spotted pattern induce by a local clear-cut disturbance. Downhill direction is to the right. Produced by Erez Gilad.
Can't see the movie? here it is in animated GIF.
Further reading:
- Patterns of Green in the Desert Brown (Phys. Rev. Focus article, 2001)
- Vegetation patterns and desertification (Newman Information Center)
- Ecosystem engineers, a missing link in exploring biodiversity: A pattern-formation approach (JSMF research award, 2003)
- Symmetry Breaking Patterns and Eco-Complexity (PhysicaPlus, Online Magazine of the Israel Physical Society, Issue 3, 2004)
See also Recent Publications link in http://www.bgu.ac.il/~ehud
Optical diagnosis using advanced spectroscopic and computational techniques
Shaul Mordechai
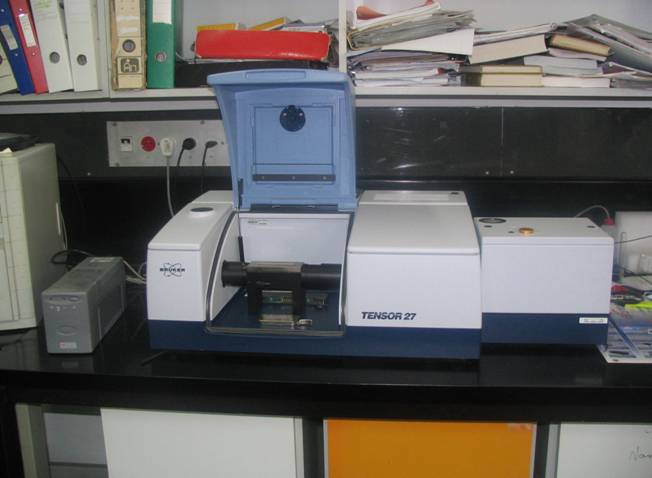
he rapid developments in the field of infrared spectroscopy in the past decade have shown a potential for disease diagnosis using non-invasive technologies. Several earlier studies have highlighted the advantage of IR spectroscopy both in the near and mid IR regions for diagnostic purposes at clinical levels . The areas of focus have been the distinction of premalignant and malignant cells 1 and tissues from the normal using specific parameters obtained from FTIR spectra, making it a rapid and reagent free method. While it still requires pilot studies and designed clinical trials 2 to ensure the applicability of such systems for cancer diagnosis, substantial progress has been made in incorporating advances in computational methods into the system to increase the sensitivity of the entire set up making it an objective and sensitive technique suitable for automation to suit the demands of the medical community. The development of fiber-optics systems 3,4 for IR spectroscopy (Fig. 1 and Fig. 2) have further opened up new and modern avenues in medical diagnosis in-vivo at various levels of cells, tissues and organs under laboratory and clinical conditions. Autofluorescence from intracellular chromophores upon illumination of cells by a monochromatic light (Fig. 4) has also been found as a powerful complementary and sensitive technology for the early detection of cancer 5.
 |
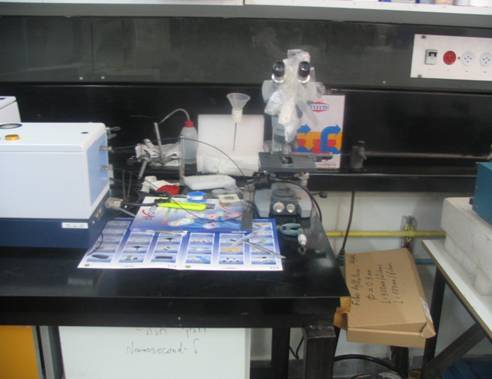 |
| Figure 1 | Figure 2 |
 |
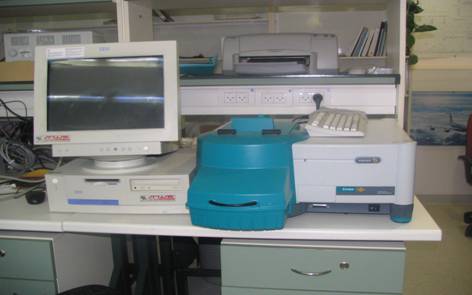 |
| Figure 3 | Figure 4 |
Non-equilibrium Localized Structures
Ehud Meron
Localized spatial structures, such as defects in periodic patterns, fronts and vortices, are ubiquitous in non-equilibrium systems. Understanding the mechanisms by which they form, their stability and how to manipulate them, is significant for exploiting them in technological applications.
A localized structure may involve a single mode, e.g. a spiral wave in an oscillating medium (showcasing a Hopf mode), but quite often richer structures appear. This is particularly true when a system is driven far from thermal equilibrium and the number of growing modes increases. The system may still be governed by a single dominant mode that damps all other modes by means of nonlinear mode coupling. However, localized structures of the dominant mode, where its amplitude vanishes or becomes sufficiently small, can host the hidden damped mode, giving rise to multimode structures. We studied structures of this kind in systems that go through dual (Hopf-Turing) instabilities. Among our findings are defect lines acting as self-organized wave-guides for traveling pulses (Fig. 1), breathing defects, and multi-state localized structures, that are potentially significant for data storage applications.
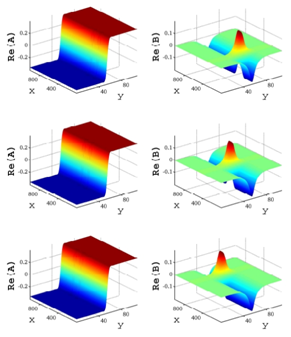
Figure 1: Self-organized waveguide. A pulse of a Hopf mode (amplitude B) propagating along a defect line in a Turing pattern (amplitude A). Time proceeds from top to bottom. Produced by Adam Lampert.
Further reading:
- A. Lampert and E. Meron, "Localized structures as spatial hosts for unstable modes", Europhys. Lett. 78 (2007) 14002.
Bacterial nucleoid structure and dynamics and its interaction with the membrane
Oleg Krichevsky
Bacterial DNA (nucleoid) is highly compacted. Once the nucleoid is gently removed from bacteria, it expands almost 100-fold and occupies the volume many times that of bacteria. What forces keep the nucleoid in its condensed form inside the bacteria? What are the main features of nucleoid structure and dynamics? How nucleoid interacts with the bacterial membrane?
In collaboration with Prof. Itzhak Fishov, Life Sciences.
 |
 |
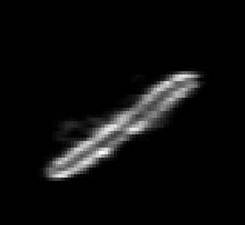
| Figure 1: E. Coli bacteria: the membrane is stained with fluorescent dye | Figure 2: The extracted bacterial nucleoid expands to a volume ~ 30 times that of bacteria. |
- Further reading:
Internal dynamics of biological polymers: DNA molecules, actin filaments
Oleg Krichevsky
The problem of polymer dynamics is rather old, going back to the 1930-s.
How the stochastic thermal motion (diffusion) reveals itself in the dynamics of polymer segments which are bound by connectivity along the chain, by polymer stiffness, by topological constrains, by hydrodynamic and other interactions? The question does not have simple solutions either in theory, nor in computer simulations, and neither in experiments. We have developed an original experimental approach to measure the dynamics of biological polymers, such as DNA at the level of single monomer with high temporal and spatial resolution.
Furthermore, one does not have to rely on classical thermal fluctuations to drive the dynamics of the system. We introduce now molecular motors "little nanomachines" which actively push polymers around at the nanoscale.
In collaboration with Dr. Anne Bernheim-Groswasser, Chem. Eng.
Animation 1: The dynamics of a semi-flexible polymer.
- Further reading:
Single Molecule Studies of DNA-protein interactions
Mario Feingold
We use Optical Tweezers to manipulated single DNA molecules. This method can be used to probe various processes in which the DNA plays a role. In particular, we use this approach to study the interaction between the DNA and sequence specific proteins. Such protein will first search for the appropriate sequence on the DNA and once it has found it will initiate a binding process. These processes will influence the DNA that, in turn, will affect the position of the bead in the optical trap. The displacements that need to be observed in order to monitor such process are in the nanometer range and are the limit of the resolution of such a setup. On the other hand, one could amplify the effect by using a DNA that has several copies of the binding sequence.
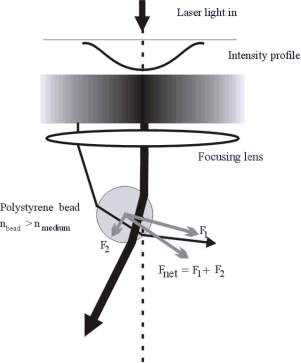
Figure: Optical Tweezers trap microbeads that can be attached to single DNA molecules. It is like having a handle at the end of the DNA.
Single Cell Dynamics
Mario Feingold
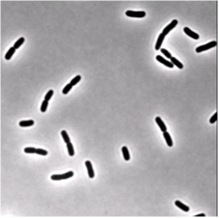
We use single cell phase-contrast and fluorescence time-lapse microscopy to monitor the morphological changes during the division of E. coli. To bypass the limitations of optical resolution, we process the images using pixel intensity values for edge detection. We study the dynamics of the constriction width, W, and find that its formation starts shortly after birth much earlier than can be detected by simply viewing phase-contrast images. A simple geometrical model is shown to reproduce the behavior of W(t). Moreover, the time-dependence of the cell length, L(t), consists of three linear regimes. The growth rates in the different regimes are related to each other and to the parameters of our model.
 |
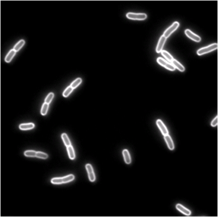 |
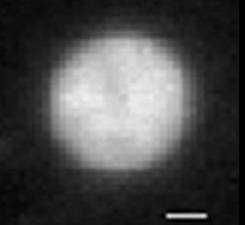
| Phase-contrast (right) and fluorescence (left- stained membrane) images of bacteria (E.coli). | |
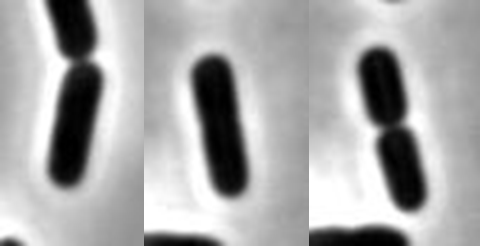 |
| This is life: 1.5 min (a), 8.6 min (b) and 19.4 min © from birth. In © the bacterium has just divided. |
 |
| During the lifetime of a bacterium it elongates linearly in three regimes. The transition between these regimes is rather sharp. Click to enlarge. |