Pressure Induced Structural and Electrical Phase Transitions in disordered materials: Silicon monoxide and the Anderson transition
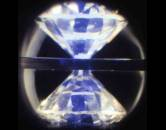
Application of very high pressure significantly alters the nature of intermolecular interaction, chemical bonding, molecular configuration, and crystal structure of solids. Practically we use Diamond Anvil Cell (Fig. 1) to produce pressures in the range from 1 and 40 GPa. Electronic correlations effects induced by high pressure results unusual phase transitions. Our main interest is focused on amorphous systems such as silicon
monoxide, where we observed an insulator to metal transition at pressure of 12 GPa (all in the amorphous phase). The temperature dependence of the conductivity is in very good agreement with the Anderson model for amorphous materials indicating Anderson transition in disordered systems. The material response to high pressure is studied by a variety of experimental methods: x-ray diffraction using synchrotron radiation, IR spectroscopy, Raman scattering and electrical conductivity measurements.
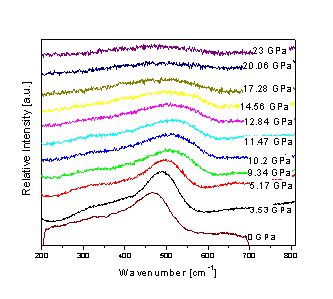
For example, the Raman scattering spectra and the pressure dependence of the resistivity for SiO sample are presented in figures 2 and 3 respectively. IR and Raman results assign bond-bending to Raman active modes since it is hardened under pressure, whereas IR active modes are dominated by bond-stretching modes.
The miniature sample (~100 μm in diameter) we use in high pressure studies makes the electrical resistivity measurements a challenging experimental problem. However, we managed to observe a dramatic drop of the resistivity on one hand (Fig. 3), and significant change in the temperature dependence of the resistance on the other, both happen at pressure 12 GPa. Short-rang order on the molecular scale helps us explain the insulator to metal transition in terms of Anderson's theory of localization, where lone-pair electrons create states in the gap.
 |
 |
 |
| Figure 1: Diamond Anvil Cell | Figure 2: The Raman scattering spectra of SiO sample at different pressures. | Figure 3: The pressure dependence of the resistivity for SiO sample. |