Research
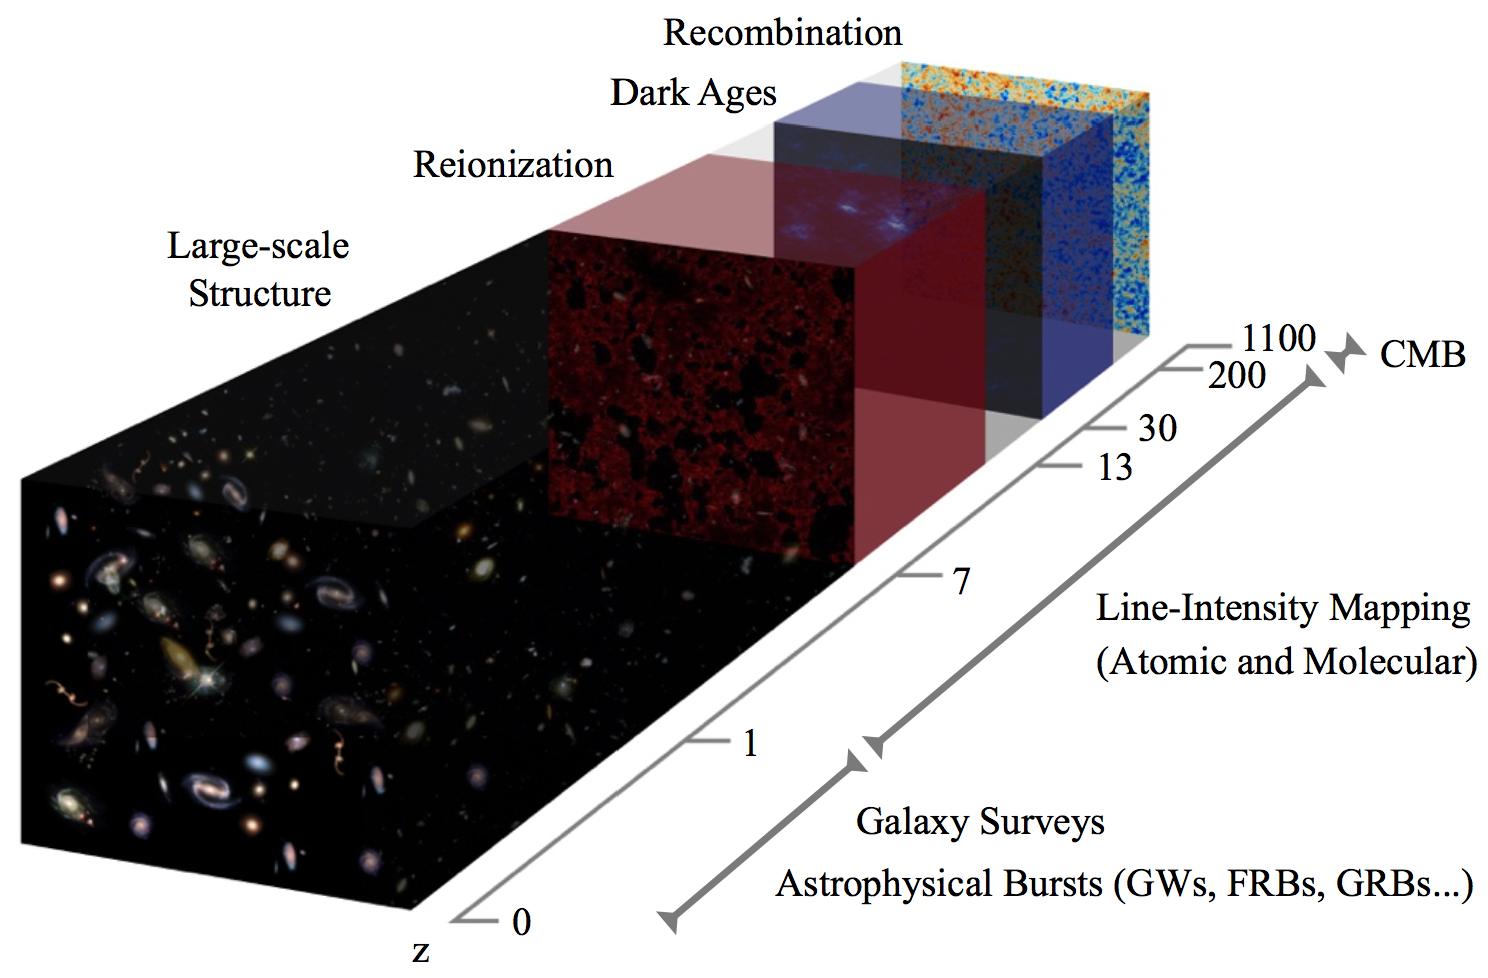
The Observable Universe: probes of different epochs in its history.
Opening Up New Windows to Study the Universe
The Standard Model of Cosmology aims to explains
the cosmic evolution from a fraction of a second
after the Big-Bang singularity to the current period
of accelerated expansion with only a handful of
parameters. Over the past decade, it has withstood a
wide series of observational tests. Yet several
gaping holes remain in the theory:
- How did inflation begin and come to an end?
- What makes up the dark matter in the Universe?
- What is the nature of dark energy?
- How did galaxies and clusters of galaxies form and
evolve to make up the large scale structure we
observe today?
Going forward, we must develop new ways to probe
these fundamental questions by accessing the full
volume of the observable Universe. This is the focus
of my research.
The Cosmic Microwave Background: Exploring the Early Universe
Line-Intensity Mapping: Astrophysics and Cosmology at High Redshifts
Why am I interested?
Line-Intensity Mapping
Line-Intensity mapping is an invaluable method to study the universe in between the regimes accessible to galaxy surveys and the CMB. It consists of low-resolution measurements of the fluctuations in the integrated emission of atomic and molecular spectral lines. As reviewed in Kovetz et al. (2017), a Status Report composed following a workshop I organized at JHU, this is an emerging field, expecting a flood of new data from upcoming surveys. I have proposed a wide range of uses of this method, from probing dark matter to measuring star-formation, and continue to explore new ways to exploit its vast potential.
The 21cm HI Transition

Top: global brightness temperature as a function of redshift. Bottom: fluctuations in the brightness temperature. This is the first lightcone simulation to be generated by a publicly available code, 21cmFirstCLASS, that extends from recombination through the dark ages and cosmic dawn to the end of reionization. From Flitter and Kovetz (PRD, 2023).
Recently, following the EDGES detection of an anomalous 21cm absorption profile at z~17, we investigated in detail the viable parameter space for millicharged dark matter to explain the EDGES signal. We provided a thorough analysis of the effect on the CMB and the 21cm in the strong coupling regime, and derived the most stringent constraints on this model.
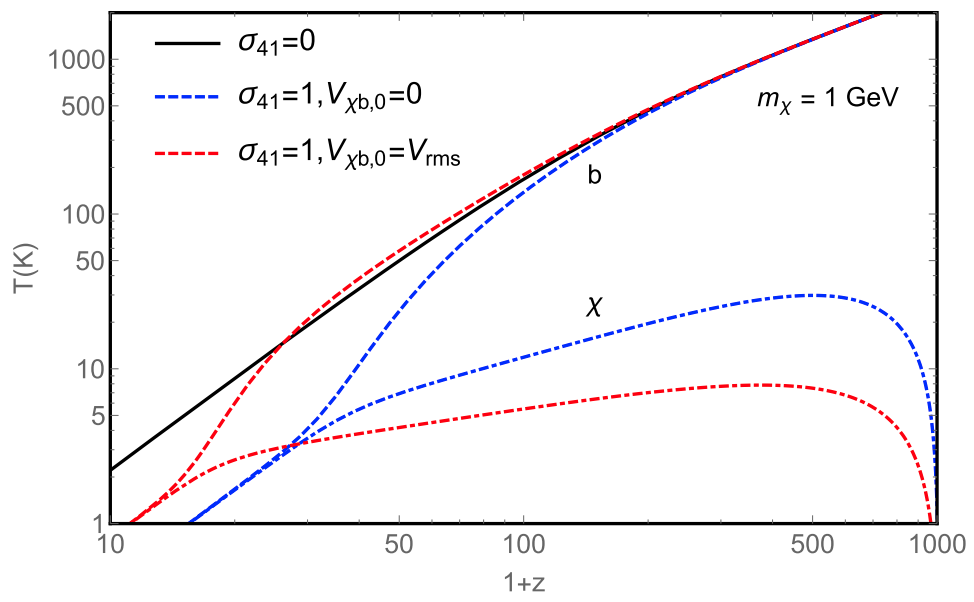
Left: Baryon temperatures (three upper curves) without interactions (solid curve) and when adding interactions (dashed-blue curve for the case where the relative velocity between baryons and dark matter is not taken into account, and red curve when it is), as well as dark-matter temperatures (two lower curves, same scenarios). At late times and for DM mass mχ below a GeV, our prediction was cooling of the baryon gas temperature, which would generate a deeper 21cm absoprtion profile (interestingly matching what EDGES measured a few years later). From Muñoz, Kovetz and Ali-Haïmoud (PRD, 2015).
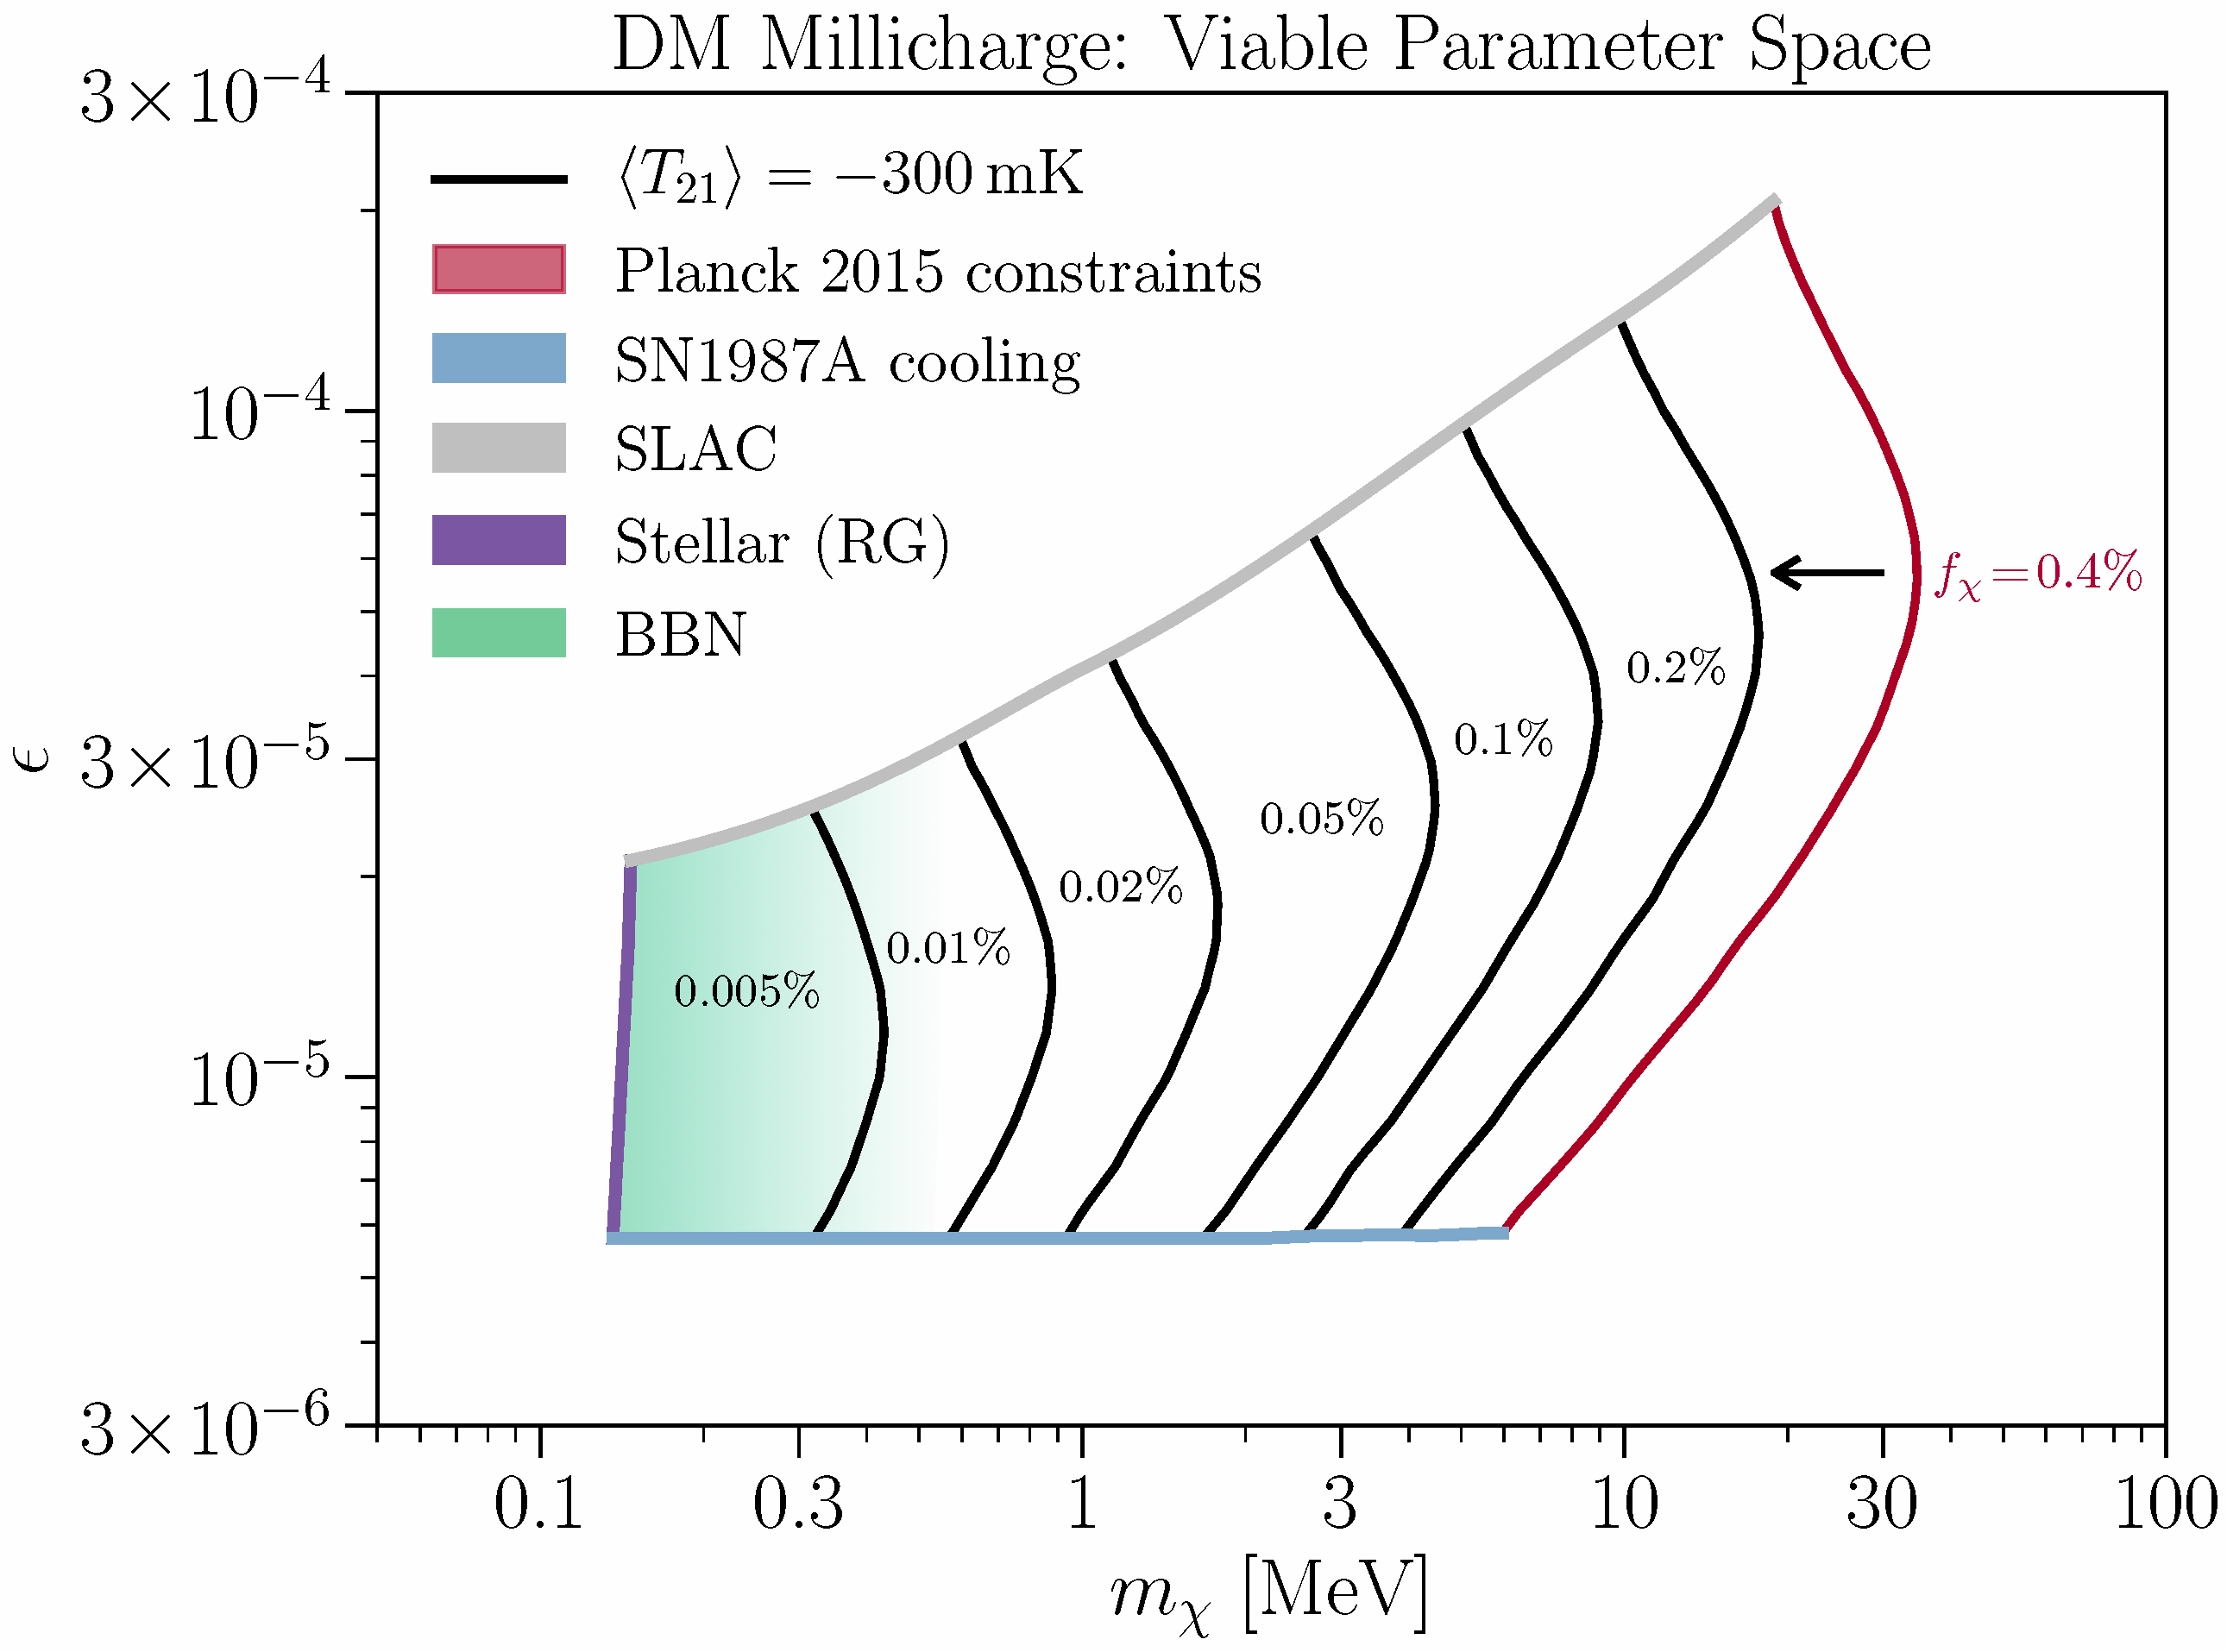
Right: The viable parameter space for millicharged DM to explain the anomalous EDGES 21cm signal. The allowed region is bound from above by SLAC constraints (gray), from the left by stellar cooling (purple), from below by SN1987A cooling (blue), and from the right by the requirement to cool the baryons enough to yield a 21cm brightness temperature consistent with the EDGES 99% upper bound (black). Contours are shown for several values of the fraction fχ of the total DM that is millicharged; each yields an upper bound on the mass mχ. The rightmost limit is from Planck 2015 (red). A portion ruled out by the Neff limit at BBN, valid below mχ∼me, is sketched (light green). From Kovetz et al. (PRD, 2018).
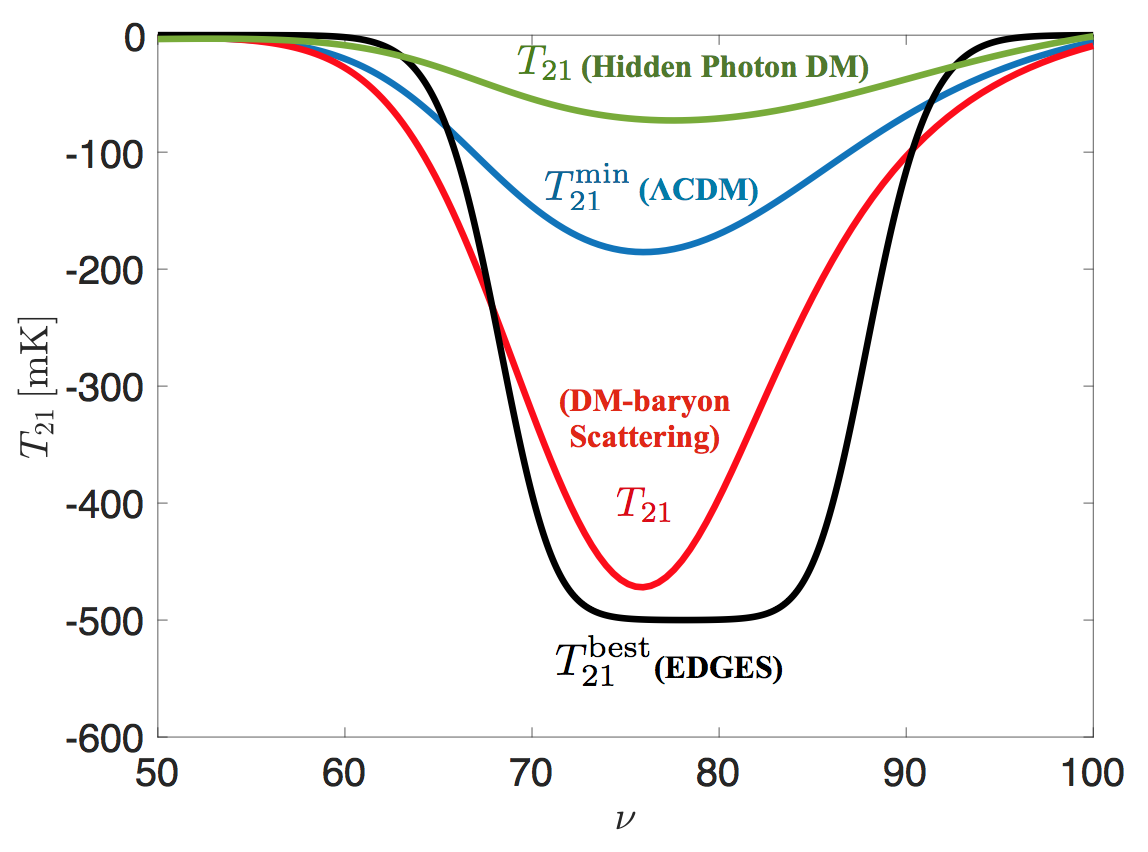
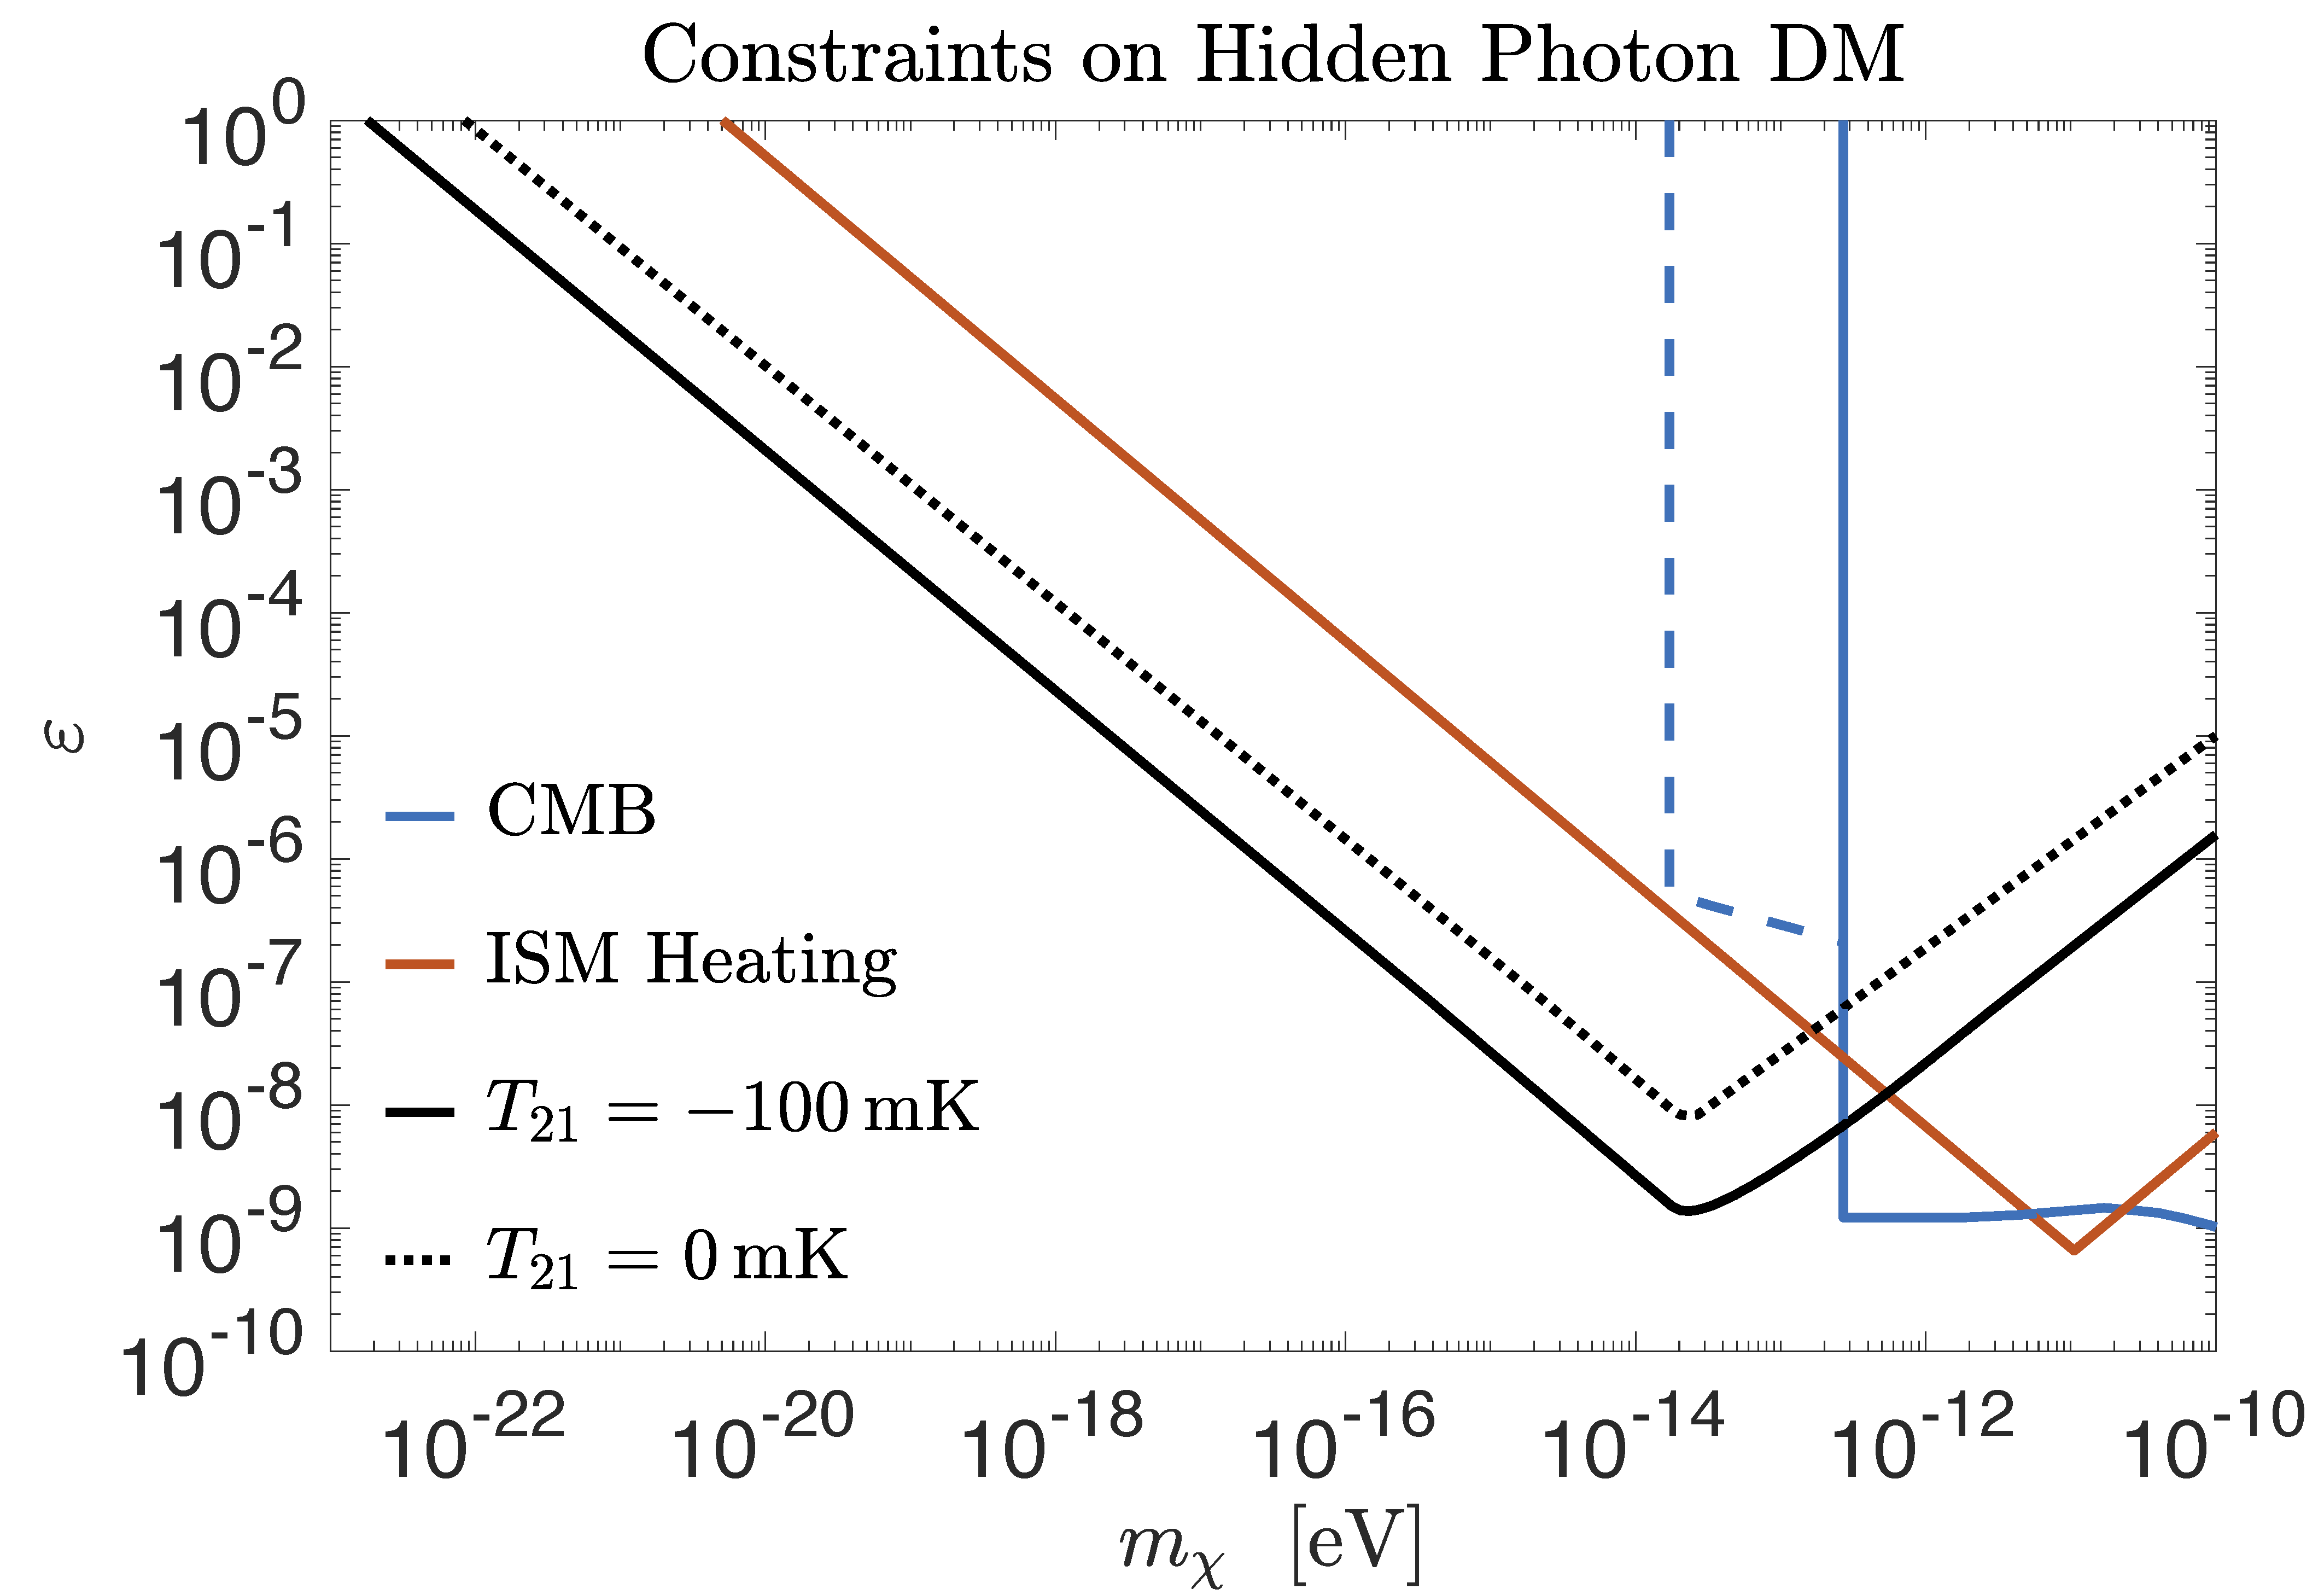
Left: The EDGES Cosmic Dawn 21cm signal (Bowman et al., Nature 2018) is in 3.8σ disagreement with the maximum absorption allowed by ΛCDM. In Kovetz et al. (2018) we present the viable parameter space of the millicharged DM model suggested to explain this anomaly by Barkana (Nature, 2018), based on the calculation in Munoz, Kovetz and Ali-Haımoud (2015). Meanwhile, in Kovetz, Cholis and Kaplan (2018) we show that a robust 21cm detection can place the strongest bounds yet on ultra-light hidden-photon DM (see right panel).
Right: Predominant bounds on the kinetic mixing parameter ε for different hidden-photon DM masses mχ. We show constraints from Milky-Way ISM heating (red) and from the CMB (blue). Our inferred 21cm bounds from requiring that T21 = −100 mK or T21 = −50 mK (black and dashed-black) are two orders of magnitude stronger over ten orders of magnitude in mass and the only ones to penetrate the fuzzy-DM mass range. From Kovetz, Cholis and Kaplan (Submitted to PRL, 2018).
- BCCP Workshop (2013): "Probing localized structures using
weak-lensing of 21cm fluctuations”
- Harvard Particle Physics
Seminar (invited, 2016): "Cosmological Probes of Dark Matter
off the Beaten Path”
- University of Maryland
HEP Seminar (invited, 2018): "Dark Matter in Light of the 21cm
EDGES Signal”
- "Beyond the Standard
Model" Workshop, GGI, Florence, Italy (invited, 2018): "New Cosmological Probes of the
Lightest and Heaviest Dark”
- Kovetz and Kamionkowski,
PRD 2013: "Galaxy-Cluster Masses via
21st-Century Measurements of Lensing of 21-cm
Fluctuations"
- Kovetz and Kamionkowski,
PRL 2013: "21-cm Lensing and the Cold Spot in
the Cosmic Microwave Background"
- Muñoz, Kovetz and Ali-Haïmoud, PRD 2015: "Heating of baryons due to scattering
with dark matter during the dark ages"
- Kovetz, Poulin, Gluscevic, Boddy, Barkana and
Kamionkowski, PRD 2018: "Tighter Limits on Dark Matter
Explanations of the Anomalous EDGES 21cm Signal"
- Kovetz, Cholis and Kaplan (PRD, 2018): "Bounds on Ultra-Light Hidden-Photon
Dark Matter from 21cm at Cosmic Dawn"
- Sarkar, Flitter and Kovetz (PRD, 2021): "Exploring delaying and heating
effects on the 21-cm signature of fuzzy dark matter"
Line-intensity mapping: emission from galaxies

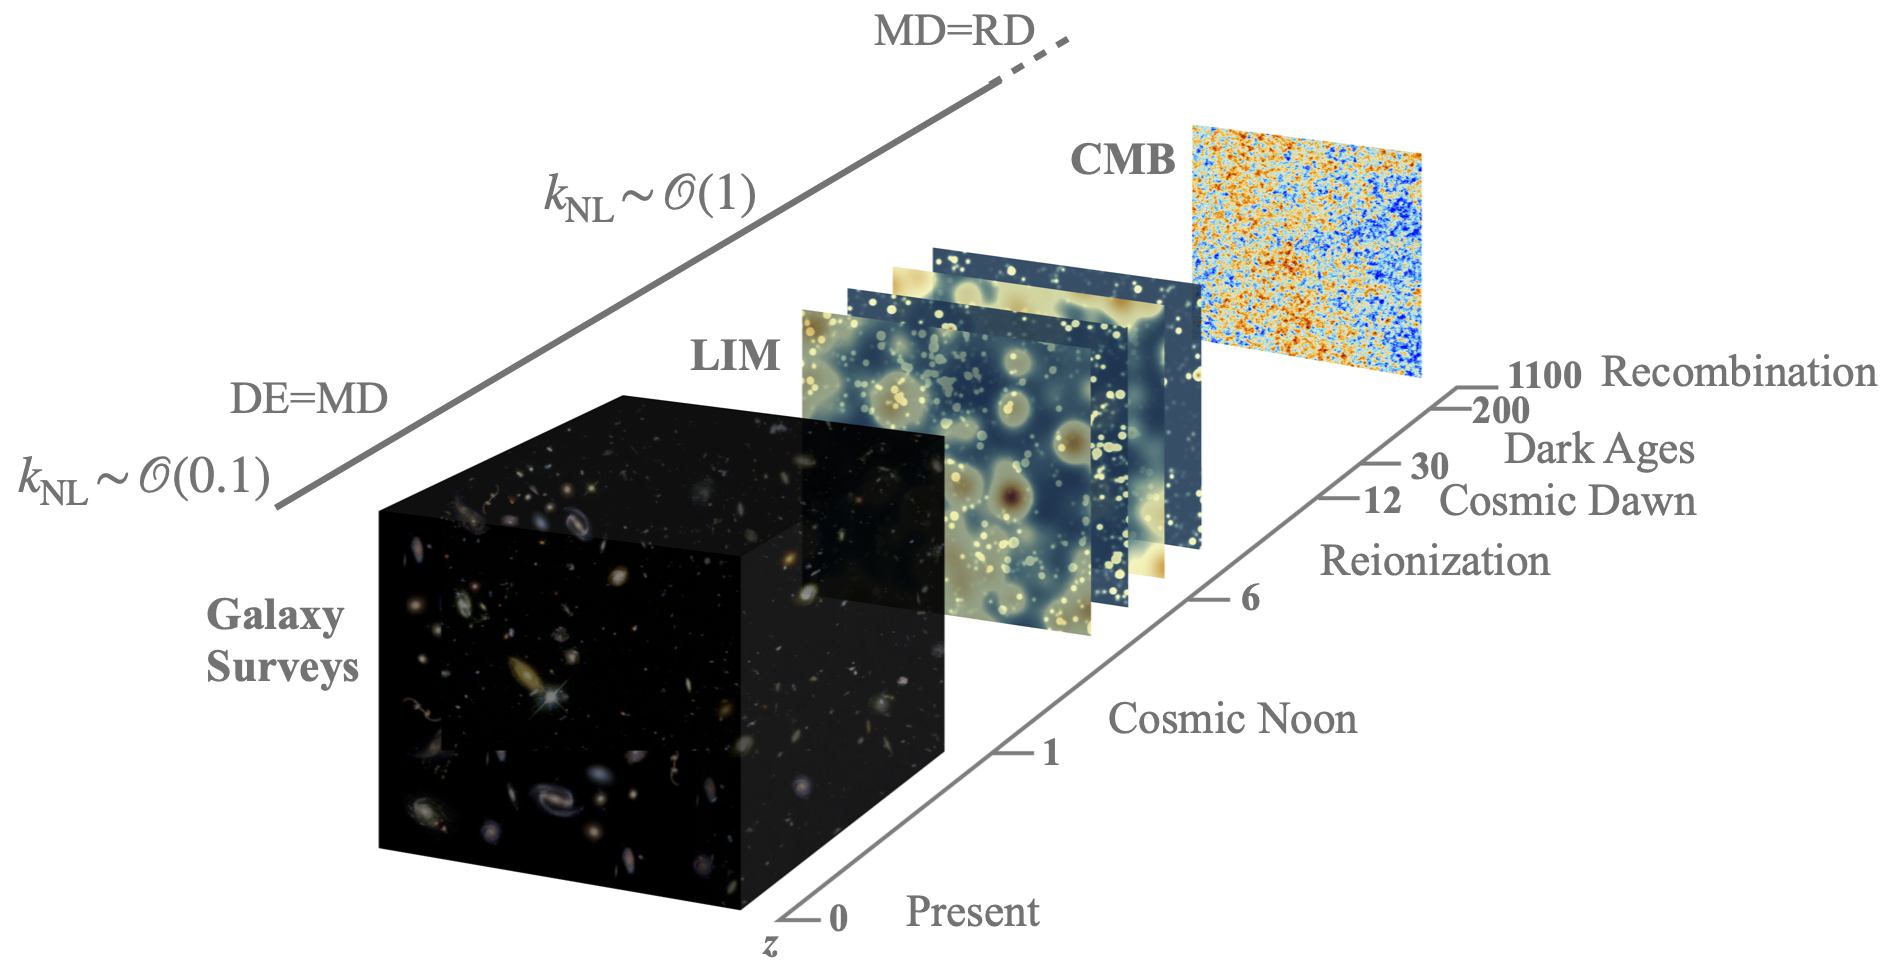
Top: a 1-degree field at redshift 5. We show (from left to right): all the galaxies; "observable'' galaxies (assuming an arbitrary cut off in the stellar masses as a theoretical proxy for detection threshold); and maps of the CO and [CII] intensity fluctuations from this field (characteristic angular resolutions of instruments targeting each line are applied). Bottom: Intensity mapping of multiple line emissions provides rich access to redshift volumes otherwise inaccessible, enabling detailed study of various important epochs in cosmic history. Above the arrow of time on the left, MD=RD and DE=MD denote the redshifts of matter-radiation, and dark energy-matter equality, respectively. We also include a rough estimation of the scale at which matter clustering becomes non linear. From Bernal and Kovetz (TAAR, 2022).
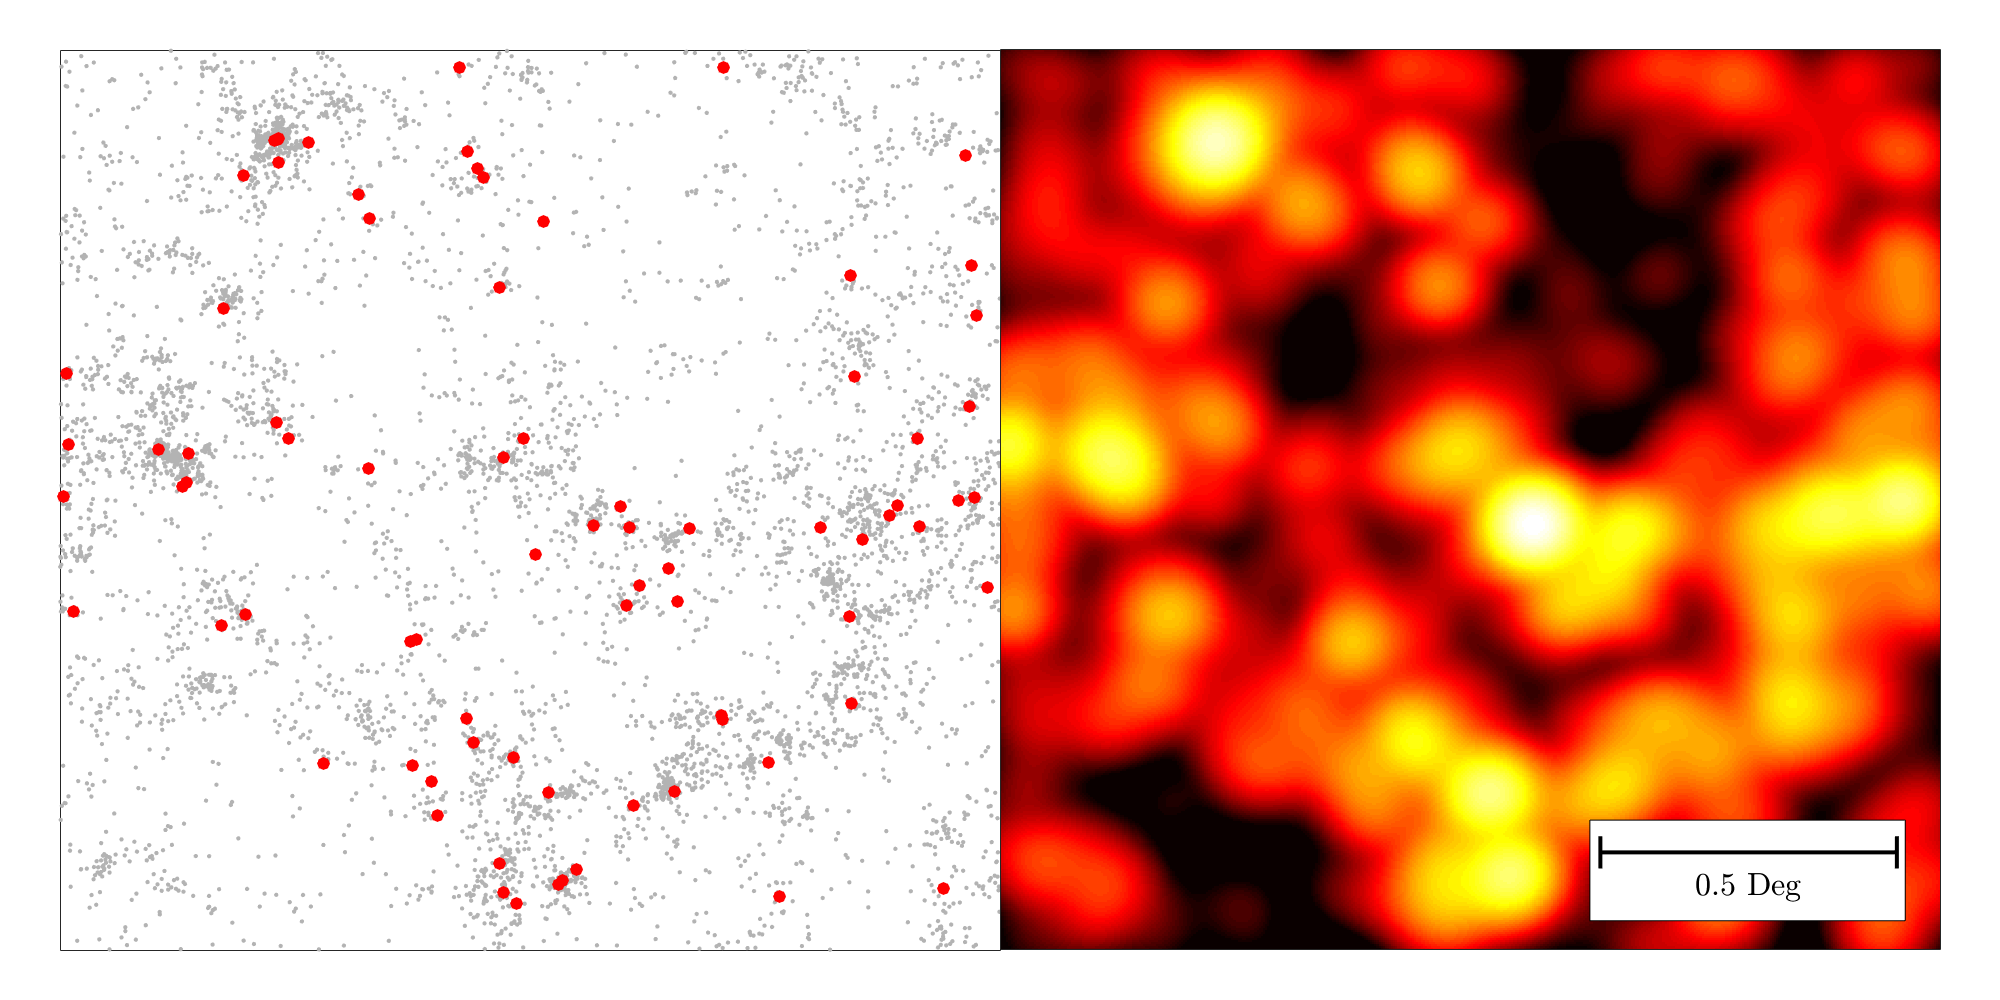
Left: Demonstrating the power of intensity mapping - a simulated 2.5 deg^2 field with galaxy positions (left side) and the corresponding CO intensity map (right side). Luminosities were drawn from a Schechter function model (Breysse, Kovetz and Kamionkowski, 2016). Sources bright enough to detect with 1hr of VLA time are marked in red. In the same 3000 hours of integration over this field required for the VLA detections, a low-cost experiment like COMAP can provide the intensity map on the right. From Kovetz et. al (Physics Reports, in review 2017) .
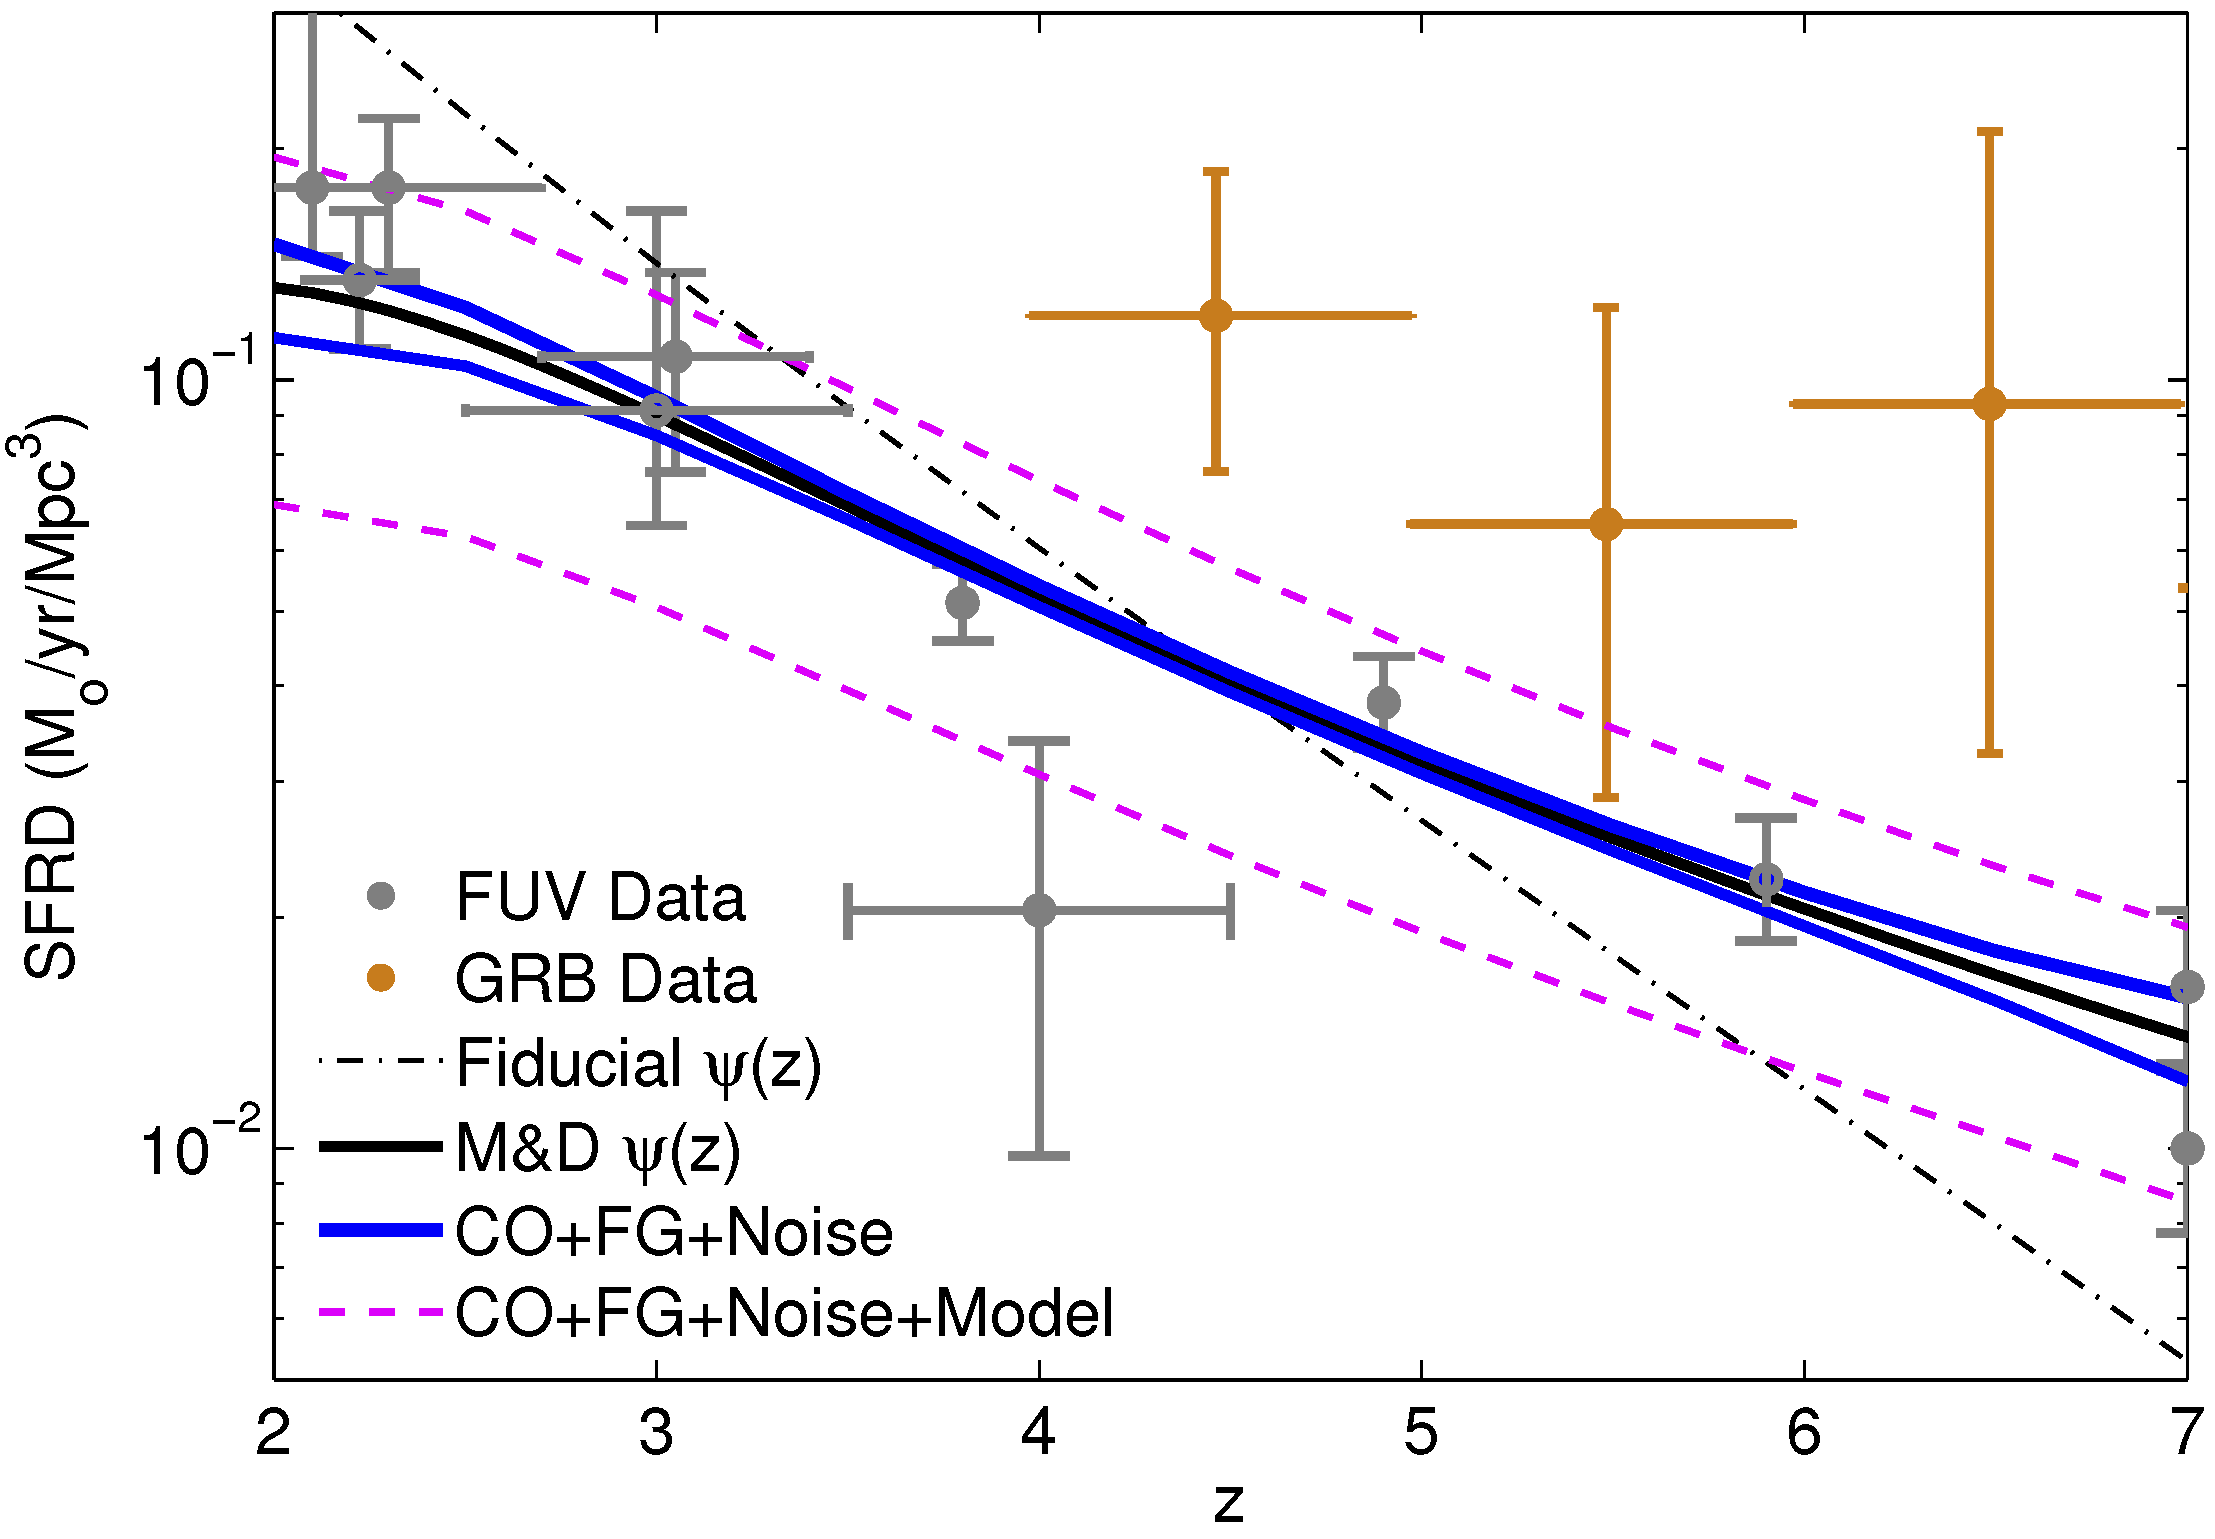
Right: Comparison between predicted constraints on star formation rate density from CO intensity mapping and from existing FUV (grey points) and GRB (orange points) data. Solid black curve ψ(z) shows fit to FUV data. Blue curves show ±1σ SFRD uncertainty forecast with CO intensity mapping, taking into account foregrounds and noise. Dashed magenta lines encompass a 10% model uncertainty band in the adopted CO-FIR and FIR-SFR relations. From Bryesse, Kovetz and Kamionkowski (MNRASL, 2016) .
- Weizmann Institute
(invited, 2016): "Signals and Interlopers:
Exhausting Cosmological Information from the Depths
of the Observable Universe ”
- Conference,
“Cosmological Signals from Cosmic Dawn to the
Present”, Aspen, CO (invited review talk, 2018): "Line-Intensity Mapping:
(Bird’s-Eye) Theory Review”
- Breysse, Kovetz and
Kamionkowski, MNRAS 2014: "Carbon Monoxide Intensity Mapping
at Moderate Redshifts"
- Breysse, Kovetz and
Kamionkowski, MNRAS 2015: "Masking Line Foregrounds in
Intensity Mapping Surveys"
- Breysse, Kovetz and
Kamionkowski, MNRAS Letters 2016: "The High Redshift Star-Formation
History from Carbon-Monoxide Intensity Maps"
- Breysse, Kovetz,
Behroozi, Dai and Kamionkowski, MNRAS 2017: "Insights from Probability
Distribution Functions of Intensity Maps"
- Bernal, Breysse,
Gil-Marin and Kovetz, PRD 2019: "A User’s Guide to Extracting
Cosmological Information from Line-Intensity Maps"
- Bernal, Breysse and
Kovetz, PRL 2019: "The Cosmic Expansion History from
Line-Intensity Mapping"
- Sato-Polito, Kovetz and
Kamionkowski, PRD 2020: "Antisymmetric cross-correlation of
line-intensity maps as a probe of reionization"
Collaborations
After the JHU workshop, we compiled a status report of the line-intensity mapping field following the two workshops. In between, during and after these two workshops, through their presentations, personal writing assignments and feedback on drafts, over 45 scientists (from over 25 institutions) contributed to the 2017 Status Report, while a small writing group was responsible for editing, combining and integrating the individual contributions.
The next community workshops took place at Aspen (2018), CCA (2019), Marseille (2019), UChicago (2021), MPA (2023).
- Kovetz et al. (Physics
Reports, in review 2017): "Line Intensity Mapping: 2017
Status Report”
